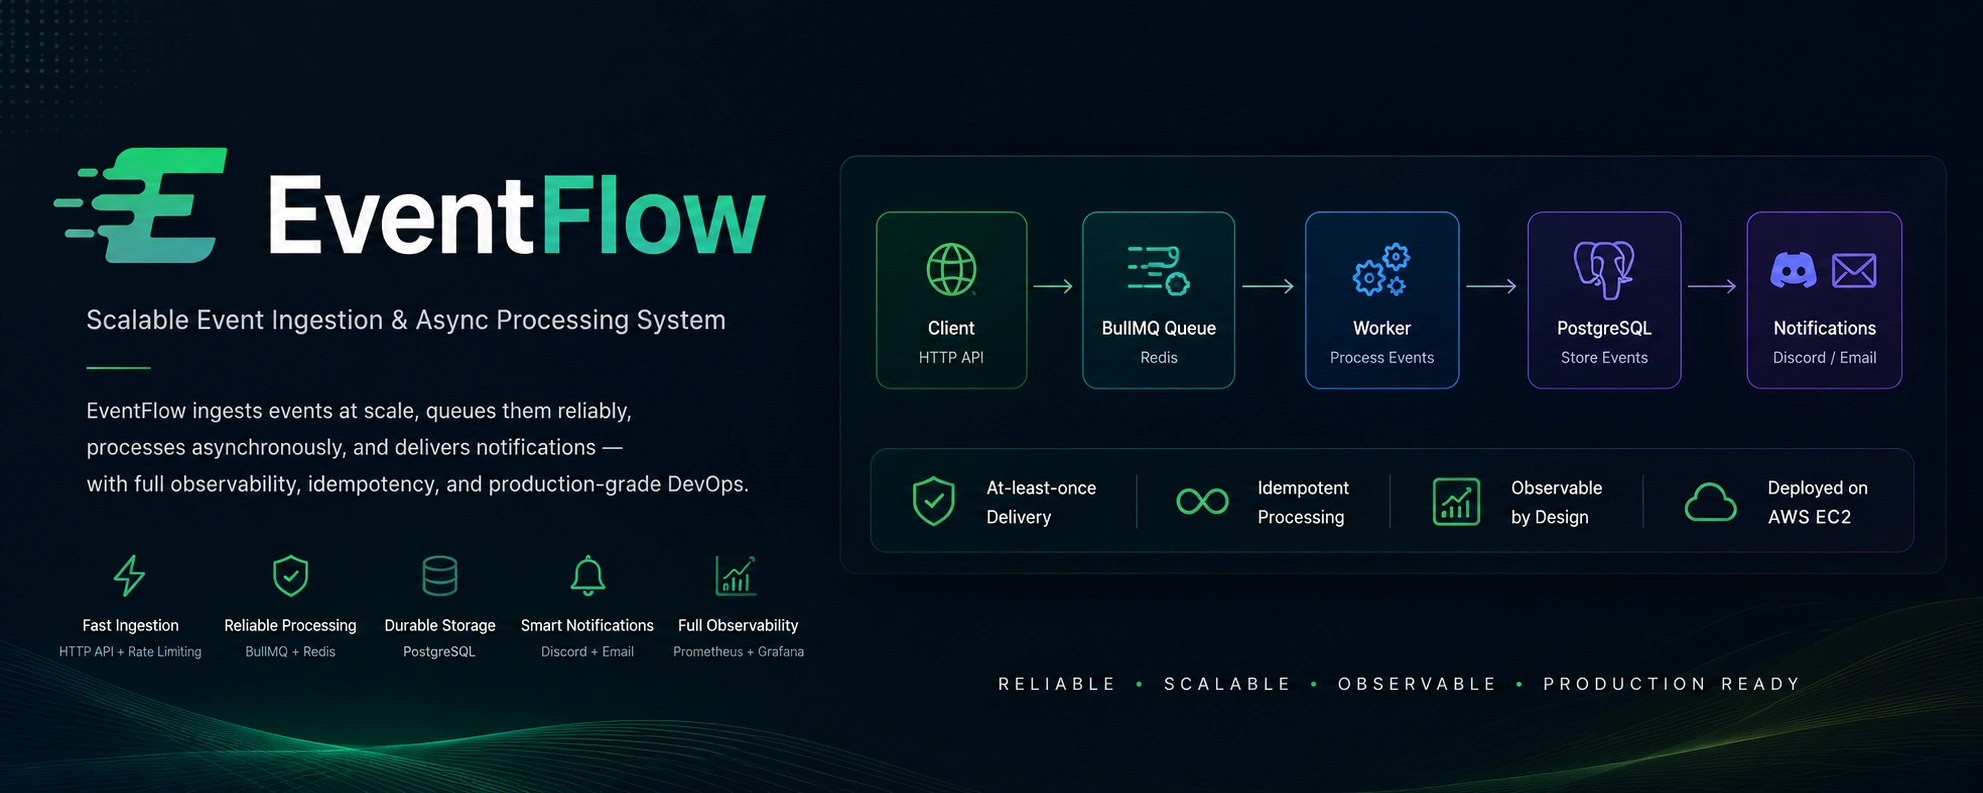
High-throughput event systems fail under three common patterns: tight coupling between ingestion and processing (slow downstream kills API latency), lack of exactly-once guarantees (retries create duplicate records and notifications), and zero observability (impossible to trace a specific request across services when an incident happens at 3am). Most student projects solve only the happy path — they break under concurrency, give up reliability guarantees, and produce no metrics.
The Solution
Decoupled ingestion from processing using a separate worker process backed by BullMQ. The API returns 202 Accepted in under 20ms regardless of downstream latency. Exactly-once delivery is simulated over BullMQ's at-least-once guarantee via three idempotency layers: client UUID key at the API, prisma upsert in the worker, and an insert-first mutex in notification_log using PostgreSQL's unique constraint. Three rate limiting algorithms (fixed window per IP, sliding window per API key, token bucket for Discord outbound) each with distinct fail modes. Full observability: Prometheus scraping custom counters from both API and worker, Grafana dashboard auto-provisioned from JSON, correlation IDs threading every request from API log through BullMQ job data into worker logs and the database. Load tested with autocannon: 10,500 req/s at p99 5ms under 20 concurrent connections, zero errors.
Technical Case Study
EventFlow --- Case Study
The Core Problem
Most production-grade event processing systems fail in one of three
ways:
Synchronous Coupling --- The API waits for the database write
and outbound notification to complete before responding. A slow
third-party webhook (e.g., Discord) drags down API response times
for every user across the system.
No Reliability Guarantees --- On a retry event, duplicate
inserts occur, or the same notification gets sent multiple times
because the system lacks a mechanism to verify past state.
Zero Observability --- When a failure breaks at 3 AM,
engineering teams face isolated logs across disconnected processes
with no trace to connect which incoming API request triggered which
worker exception.
EventFlow was engineered to solve all three---not as a theoretical
whitepaper, but as a fully functioning, load-tested asynchronous
architecture.
System Architecture
[ Client Request ]
                                    │
                                    ▼
[Correlation ID Middleware] ──▶ Generates/reads x-request-id, threads through pipeline
                                    │
                                    ▼
[IP Rate Limit]             ──▶ Fixed window, 200/min per IP, fails OPEN
                                    │
                                    ▼
[Auth Middleware]           ──▶ SHA-256 key lookup, Redis cache-aside (60s TTL)
                                    │
                                    ▼
[API Key Rate Limit]        ──▶ Sliding window, 100/min per tenant, fails CLOSED
                                    │
                                    ▼
[Zod Validation]            ──▶ Strict payload schema parsing
                                    │
                                    ▼
[BullMQ Queue]              ──▶ Redis-backed, AOF persistence layer
                                    │
                                    ▼ (Isolated Process Boundary)
[Background Worker]
    ├─▶ PostgreSQL          ──▶ Upsert on unique idempotencyKey
    ├─▶ Discord Webhooks    ──▶ Token-bucket throttled, insert-first lock
    └─▶ Resend Email API    ──▶ Run in parallel with Discord, shared lock pattern
[!NOTE] The API and Background Worker run as separate Node.js
processes rather than simple code chunks. This separation guarantees
that a worker runtime crash never brings down the API ingestion layer,
slow external I/O does not block the API event loop, and both
processes can be scaled independently (API: horizontally, Worker:
vertically).
Key Design Decisions
1. Three-Layer Idempotency Architecture
Because BullMQ guarantees at-least-once delivery, a job can execute
multiple times. EventFlow implements a zero-leak safety net across three
distinct layers without using expensive distributed transactions:
Layer 1 --- API Ingestion (Client-Controlled): The client
provides a unique UUID idempotencyKey. Before enqueuing a job, a
findUnique check verifies if it exists. If two concurrent requests
hit with the same key simultaneously, the request that loses the
database insert race throws a Prisma P2002 unique constraint
violation. This error is intercepted in the catch block and safely
maps back to the winning request's jobId.
Layer 2 --- Background Worker (DB-Controlled): The worker
utilizes a prisma.event.upsert statement bounded by the
idempotencyKey. If BullMQ delivers a duplicate job, the second
execution simply updates the existing row instead of introducing
corrupt duplicates.
Layer 3 --- Notifications (Insert-First Mutex): The system logs
state into notification_logbefore hitting third-party APIs. If
the database row insert succeeds, the notification fires. If it hits
a P2002 collision, the system skips it silently. This
write-ahead pattern ensures durable state is committed before
executing side effects.
2. Specialized Rate Limiting Regimes
Layer Algorithm Fail Mode Operational Focus
IP Fixed Window OPEN Prevents Redis
(Pre-Auth) downtime from
blocking legitimate
users.
API Key Sliding Window CLOSED Mandates SLA
(Post-Auth) enforcement;
protects system
resources.
Why the Sliding Window? It blocks the fixed-window boundary
exploit (e.g., sending 100 requests at 12:59:59 and 100 requests
at 01:00:01, resulting in a massive spike of 200 requests within 2
seconds). The sliding window computes rate limits dynamically across
the immediate preceding 60 seconds.
Why the Token Bucket via Lua script? The read-calculate-write
sequence must execute atomically. Without wrapping this logic in a
Redis Lua script, distributed workers reading tokens = 1
simultaneously would both permit the transaction, leading to a race
condition leak.
3. Redis Caching with Negative Caching Strategy
To protect the core database from heavy load, the cache layer relies on
two isolated paths:
API Key Authentication (apikey:cache:{sha256}, TTL: 60s):
Cache Hit: Validates and returns immediately from Redis,
completely bypassing PostgreSQL.
Cache Miss: Resolves via PostgreSQL, then populates Redis.
Negative Caching: Revoked or invalid keys cache an explicit
{active: false} payload. This stops malicious actors or broken
clients from hammering the primary database on rapid retries.
Event Data Lists (events:list:{tenantId}, TTL: 5s):
Employs strict TTL-based expiration rather than an
invalidate-on-write trigger.
Because the database writer is an isolated background process,
firing cross-process invalidation triggers introduces
architectural coupling. A maximum 5-second data staleness is an
acceptable trade-off for dashboard performance.
4. Correlation ID Distributed Tracing
Every incoming request receives a unique x-request-id header (or
generates a fresh UUID). This identifier threads through the entire
execution line:
Incoming API Middleware ──▶ Target req.correlationId
  ──▶ Ingestion Log Line
    ──▶ BullMQ job.data.correlationId
      ──▶ Worker Pino Child Logger (Appended to every log payload)
        ──▶ PostgreSQL correlation_id Column (Indexed)
          ──▶ Preserved in Dead Letter Queue (DLQ) metadata
This explicit trace allows engineering teams to map out a request's full
lifecycle during an active production incident using simple tools:
# Extract API and Worker lifecycles from application stdout logs
docker compose logs api | grep <correlationId>
docker compose logs worker | grep <correlationId>

# Or pinpoint the exact footprint inside the database
SELECT * FROM events WHERE correlation_id = 'id';

# Load Testing Results
The architecture was load-tested using autocannon targeting the complete middleware stack—including the authentication cache and the sliding window rate limiters.

### Test Run 1: High Concurrency (20 Concurrent Connections, 10 Seconds)
```text
p50: 1ms  |  p99: 5ms  |  max: 46ms
Throughput: 10,535 req/s average
Status Codes: 97 × 2xx, 105,257 × 429, 0 errors
[!SUCCESS] The sliding window rate limiter intercepted 105k+
excess requests under intense concurrent traffic with zero dropped
connections. Every rejected attempt received a clean, structured 429
HTTP JSON response payload.
The data layer's P2002 conflict interceptor successfully resolves
real-time write collisions cleanly without dropping active requests or
duplicating state.
Observability Stack
Metrics Scraping: A local Prometheus instance dynamically
scrapes data endpoints from both the API container (:3000) and
Background Worker (:9091) every 15 seconds.
Custom Instrumentation: Tracks granular events including cache
hit/miss frequencies, rate limit metrics, event duplicate drops, job
completion lifecycles, and structural Dead Letter Queue (DLQ)
depths.
Visual Dashboards: An automated Grafana dashboard loads
directly via code-configured JSON definitions, requiring no manual
UI layout setup upon execution of docker compose up.
Host Observability: Integrated node-exporter monitors
system-level metrics (CPU consumption, memory load, and disk I/O
metrics).
API Specification: Auto-generates OpenAPI 3.0 / Swagger UI
docs dynamically via co-located @openapi JSDoc annotations inside
application route handlers, ensuring documentation never drifts from
the underlying code.
Infrastructure & CI/CD
Local Development Architecture: Configured via a
docker-compose.yml file that compiles local sources and boots a
database seeding process for a zero-friction development setup.
Production Architecture: Managed via docker-compose.prod.yml
which pulls optimized, multi-stage production images directly from
Docker Hub.
Automated CI/CD Pipeline: Powered by GitHub Actions. The flow
enforces: Typecheck ──▶ Docker Production Build ──▶
Automated Smoke Testing ──▶ Registry Push (:latest + :git-sha)
──▶ Automated EC2 Deployment.
Infrastructure as Code: A robust Terraform architecture
automates provision paths for Amazon EC2 nodes, security access
groups, Elastic IPs, and an S3 bucket remote state backend. The
entire platform supports a full teardown and recreation loop in
under 5 minutes.
Technical Capabilities Demonstrated
Core Engineering Concept Production Implementation